
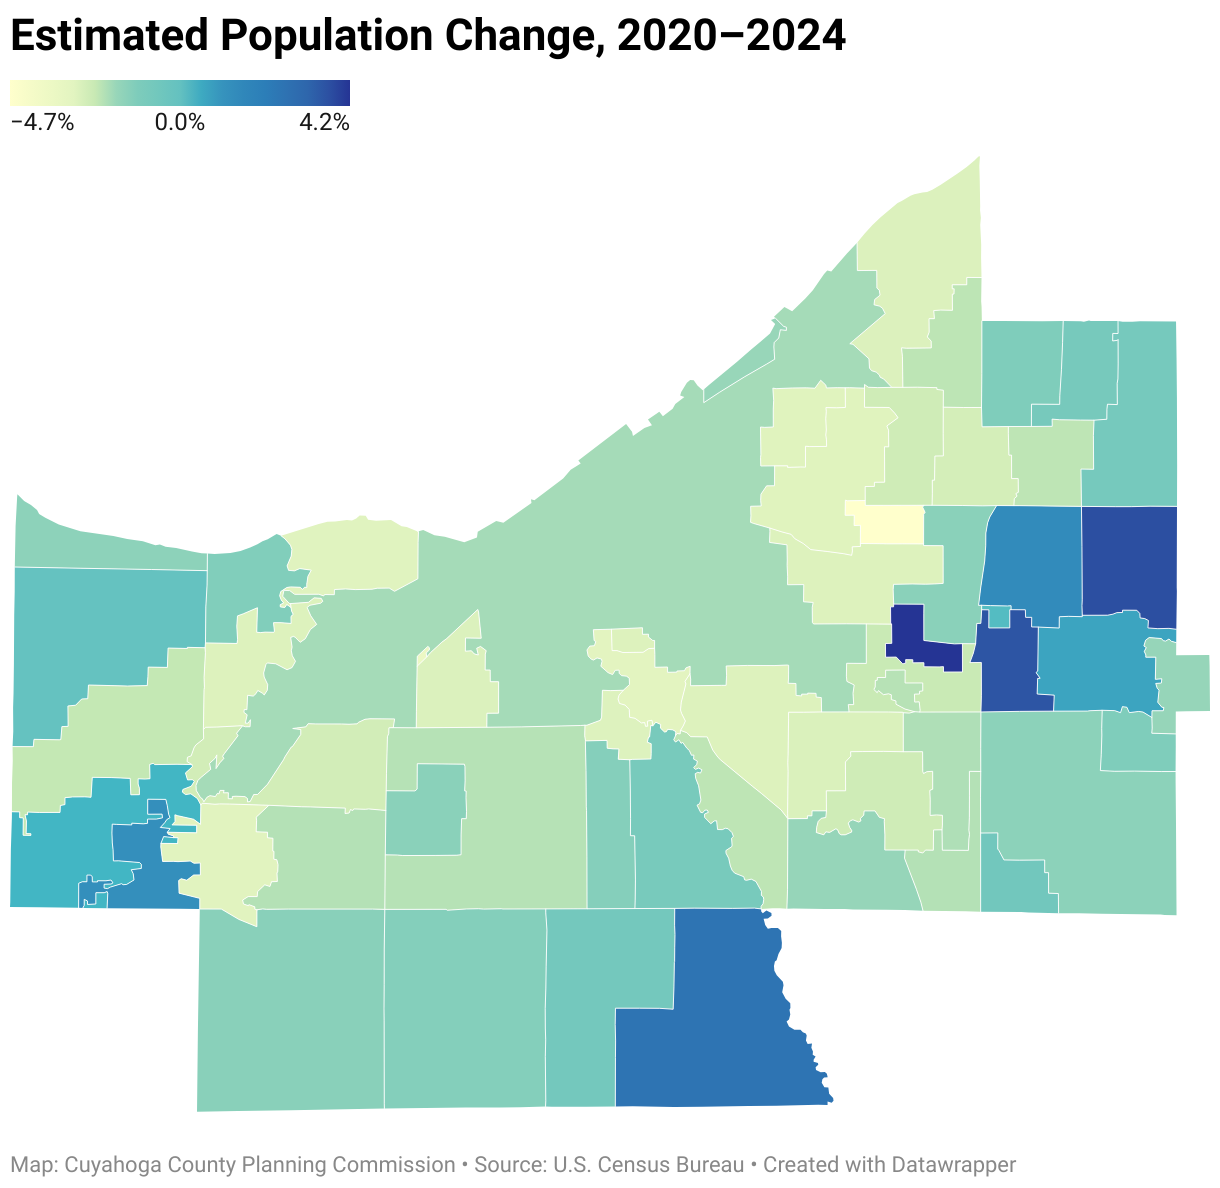
2020 to 2024 population estimates from the U.S. Census Bureau for Cuyahoga County communities and Greater Cleveland counties
Cuyahoga County Communities
| Geography | April 1, 2020 Estimates Base | Population Estimate (as of July 1) | Change April 1, 2020 (Estimates Base) to July 1, 2024 | Change July 1, 2023 to July 1, 2024 | ||||||
|---|---|---|---|---|---|---|---|---|---|---|
| 2020 | 2021 | 2022 | 2023 | 2024 | Number | Percent | Number | Percent | ||
| Bay Village | 16,164 | 16,139 | 16,010 | 15,913 | 15,884 | 15,903 | -261 | -1.6% | 19 | 0.1% |
| Beachwood | 14,040 | 14,020 | 13,903 | 13,813 | 13,796 | 13,820 | -220 | -1.6% | 24 | 0.2% |
| Bedford | 13,151 | 13,125 | 12,988 | 12,873 | 12,833 | 12,834 | -317 | -2.4% | 1 | 0.0% |
| Bedford Heights | 11,020 | 11,001 | 10,896 | 10,808 | 10,782 | 10,791 | -229 | -2.1% | 9 | 0.1% |
| Bentleyville | 898 | 897 | 888 | 890 | 886 | 887 | -11 | -1.2% | 1 | 0.1% |
| Berea | 18,525 | 18,501 | 18,393 | 18,241 | 17,997 | 17,998 | -527 | -2.8% | 1 | 0.0% |
| Bratenahl | 1,429 | 1,429 | 1,416 | 1,403 | 1,400 | 1,404 | -25 | -1.7% | 4 | 0.3% |
| Brecksville | 13,605 | 13,595 | 13,538 | 13,496 | 13,875 | 13,951 | 346 | 2.5% | 76 | 0.5% |
| Broadview Heights | 19,936 | 19,923 | 19,751 | 19,680 | 19,728 | 19,792 | -144 | -0.7% | 64 | 0.3% |
| Brooklyn | 11,360 | 11,338 | 11,217 | 11,115 | 11,074 | 11,072 | -288 | -2.5% | -2 | 0.0% |
| Brooklyn Heights | 1,520 | 1,518 | 1,501 | 1,488 | 1,482 | 1,480 | -40 | -2.6% | -2 | -0.1% |
| Brook Park | 18,595 | 18,559 | 18,370 | 18,204 | 18,144 | 18,142 | -453 | -2.4% | -2 | 0.0% |
| Chagrin Falls | 4,190 | 4,181 | 4,142 | 4,122 | 4,106 | 4,118 | -72 | -1.7% | 12 | 0.3% |
| Chagrin Falls Township | 130 | 130 | 129 | 128 | 130 | 130 | 0 | 0.0% | 0 | 0.0% |
| Cleveland | 372,626 | 371,853 | 365,432 | 363,622 | 364,276 | 365,379 | -7,247 | -1.9% | 1,103 | 0.3% |
| Cleveland Heights | 45,314 | 45,221 | 44,727 | 44,293 | 44,105 | 44,064 | -1,250 | -2.8% | -41 | -0.1% |
| Cuyahoga Heights | 573 | 572 | 565 | 561 | 557 | 556 | -17 | -3.0% | -1 | -0.2% |
| East Cleveland | 13,783 | 13,753 | 13,600 | 13,470 | 13,414 | 13,402 | -381 | -2.8% | -12 | -0.1% |
| Euclid | 49,689 | 49,586 | 49,057 | 48,603 | 48,439 | 48,421 | -1,268 | -2.6% | -18 | 0.0% |
| Fairview Park | 17,309 | 17,275 | 17,090 | 16,930 | 16,868 | 16,860 | -449 | -2.6% | -8 | 0.0% |
| Garfield Heights | 29,791 | 29,729 | 29,414 | 29,143 | 29,032 | 29,014 | -777 | -2.6% | -18 | -0.1% |
| Gates Mills | 2,268 | 2,264 | 2,253 | 2,238 | 2,240 | 2,250 | -18 | -0.8% | 10 | 0.4% |
| Glenwillow | 994 | 993 | 987 | 983 | 983 | 988 | -6 | -0.6% | 5 | 0.5% |
| Highland Heights | 8,721 | 8,710 | 8,641 | 8,583 | 8,578 | 8,612 | -109 | -1.2% | 34 | 0.4% |
| Highland Hills | 669 | 668 | 644 | 675 | 697 | 697 | 28 | 4.2% | 0 | 0.0% |
| Hunting Valley* | 625 | 624 | 632 | 630 | 640 | 648 | 23 | 3.7% | 8 | 1.3% |
| Independence | 7,585 | 7,585 | 7,546 | 7,537 | 7,515 | 7,518 | -67 | -0.9% | 3 | 0.0% |
| Lakewood | 50,940 | 50,825 | 50,268 | 49,776 | 49,564 | 49,517 | -1,423 | -2.8% | -47 | -0.1% |
| Linndale | 113 | 113 | 112 | 111 | 111 | 109 | -4 | -3.5% | -2 | -1.8% |
| Lyndhurst | 14,045 | 14,017 | 13,873 | 13,748 | 13,703 | 13,700 | -345 | -2.5% | -3 | 0.0% |
| Maple Heights | 23,681 | 23,633 | 23,385 | 23,177 | 23,087 | 23,081 | -600 | -2.5% | -6 | 0.0% |
| Mayfield | 3,353 | 3,348 | 3,318 | 3,304 | 3,310 | 3,324 | -29 | -0.9% | 14 | 0.4% |
| Mayfield Heights | 20,346 | 20,312 | 20,104 | 19,948 | 19,882 | 19,886 | -460 | -2.3% | 4 | 0.0% |
| Middleburg Heights | 16,018 | 15,989 | 15,843 | 15,716 | 15,669 | 15,672 | -346 | -2.2% | 3 | 0.0% |
| Moreland Hills | 3,466 | 3,463 | 3,441 | 3,445 | 3,457 | 3,489 | 23 | 0.7% | 32 | 0.9% |
| Newburgh Heights | 1,863 | 1,860 | 1,840 | 1,824 | 1,816 | 1,815 | -48 | -2.6% | -1 | -0.1% |
| North Olmsted | 32,439 | 32,379 | 32,068 | 31,792 | 31,686 | 31,690 | -749 | -2.3% | 4 | 0.0% |
| North Randall | 955 | 954 | 944 | 936 | 935 | 934 | -21 | -2.2% | -1 | -0.1% |
| North Royalton | 31,328 | 31,285 | 31,044 | 30,856 | 30,823 | 30,894 | -434 | -1.4% | 71 | 0.2% |
| Oakwood | 3,573 | 3,566 | 3,532 | 3,504 | 3,496 | 3,496 | -77 | -2.2% | 0 | 0.0% |
| Olmsted Falls | 8,578 | 8,653 | 8,648 | 8,620 | 8,623 | 8,676 | 98 | 1.1% | 53 | 0.6% |
| Olmsted Township | 14,520 | 14,536 | 14,540 | 14,485 | 14,513 | 14,565 | 45 | 0.3% | 52 | 0.4% |
| Orange | 3,422 | 3,428 | 3,442 | 3,485 | 3,513 | 3,544 | 122 | 3.6% | 31 | 0.9% |
| Parma | 81,121 | 80,962 | 80,167 | 79,531 | 79,310 | 79,350 | -1,771 | -2.2% | 40 | 0.1% |
| Parma Heights | 20,850 | 20,809 | 20,597 | 20,431 | 20,527 | 20,524 | -326 | -1.6% | -3 | 0.0% |
| Pepper Pike | 6,794 | 6,816 | 6,829 | 6,823 | 6,850 | 6,881 | 87 | 1.3% | 31 | 0.5% |
| Richmond Heights | 10,795 | 10,780 | 10,671 | 10,585 | 10,553 | 10,552 | -243 | -2.3% | -1 | 0.0% |
| Rocky River | 21,751 | 21,723 | 21,548 | 21,382 | 21,330 | 21,468 | -283 | -1.3% | 138 | 0.6% |
| Seven Hills | 11,728 | 11,716 | 11,644 | 11,591 | 11,557 | 11,560 | -168 | -1.4% | 3 | 0.0% |
| Shaker Heights | 29,448 | 29,382 | 29,058 | 28,790 | 28,679 | 28,689 | -759 | -2.6% | 10 | 0.0% |
| Solon | 24,260 | 24,222 | 23,998 | 23,840 | 23,813 | 23,875 | -385 | -1.6% | 62 | 0.3% |
| South Euclid | 21,891 | 21,846 | 21,626 | 21,442 | 21,361 | 21,363 | -528 | -2.4% | 2 | 0.0% |
| Strongsville | 46,487 | 46,428 | 46,143 | 45,823 | 45,719 | 45,768 | -719 | -1.5% | 49 | 0.1% |
| University Heights | 13,918 | 13,892 | 13,210 | 13,348 | 13,267 | 13,265 | -653 | -4.7% | -2 | 0.0% |
| Valley View | 1,901 | 1,898 | 1,878 | 1,862 | 1,858 | 1,858 | -43 | -2.3% | 0 | 0.0% |
| Walton Hills | 2,032 | 2,029 | 2,013 | 2,000 | 1,994 | 1,997 | -35 | -1.7% | 3 | 0.2% |
| Warrensville Heights | 13,773 | 13,745 | 13,602 | 13,486 | 13,451 | 13,450 | -323 | -2.3% | -1 | 0.0% |
| Westlake | 34,238 | 34,200 | 33,986 | 33,976 | 34,123 | 34,232 | -6 | 0.0% | 109 | 0.3% |
| Woodmere | 638 | 637 | 633 | 641 | 638 | 639 | 1 | 0.2% | 1 | 0.2% |
| Cuyahoga County | 1,264,775 | 1,262,635 | 1,247,735 | 1,239,720 | 1,238,679 | 1,240,594 | -24,181 | -1.9% | 1,915 | 0.2% |
Greater Cleveland Counties
| Geography | April 1, 2020 Estimates Base | Population Estimate (as of July 1) | Change April 1, 2020 (Estimates Base) to July 1, 2024 | Change July 1, 2023 to July 1, 2024 | ||||||
|---|---|---|---|---|---|---|---|---|---|---|
| 2020 | 2021 | 2022 | 2023 | 2024 | Number | Percent | Number | Percent | ||
| Cuyahoga County | 1,264,775 | 1,262,635 | 1,247,735 | 1,239,720 | 1,238,679 | 1,240,594 | -24,181 | -1.9% | 1,915 | 0.2% |
| Ashtabula County | 97,580 | 97,512 | 97,470 | 96,987 | 96,962 | 96,906 | -674 | -0.7% | -56 | -0.1% |
| Geauga County | 95,427 | 95,385 | 95,716 | 95,552 | 95,389 | 95,362 | -65 | -0.1% | -27 | 0.0% |
| Lake County | 232,522 | 232,527 | 232,261 | 231,968 | 231,964 | 232,360 | -162 | -0.1% | 396 | 0.2% |
| Lorain County | 312,981 | 313,534 | 314,301 | 316,616 | 319,163 | 322,030 | 9,049 | 2.9% | 2,867 | 0.9% |
| Medina County | 182,460 | 182,639 | 183,403 | 183,520 | 184,115 | 184,625 | 2,165 | 1.2% | 510 | 0.3% |
| Cleveland MSA† | 2,185,745 | 2,184,232 | 2,170,886 | 2,164,363 | 2,166,272 | 2,171,877 | -13,868 | -0.6% | 5,605 | 0.3% |
| Cleveland-Akron-Canton CSA†† | 3,769,752 | 3,767,025 | 3,745,770 | 3,739,170 | 3,742,677 | 3,750,887 | -18,865 | -0.5% | 8,210 | 0.2% |
| Ohio | 11,799,453 | 11,798,905 | 11,767,344 | 11,777,874 | 11,824,034 | 11,883,304 | 83,851 | 0.7% | 59,270 | 0.5% |
Notes
Prepared by the Cuyahoga County Planning Commission, May 15, 2025
* Estimates for Hunting Valley include only the Cuyahoga County portion.
† The Cleveland Metropolitan Statistical Area includes Ashtabula, Cuyahoga, Geauga, Lake, Lorain, and Medina counties.
†† The Cleveland-Akron-Canton Combined Statistical Area includes Ashtabula, Carroll, Coshocton, Cuyahoga, Erie, Geauga, Huron, Lake, Lorain, Medina, Ottawa, Portage, Sandusky, Stark, Summit, Tuscarawas, and Wayne counties.
The estimates are based on the 2020 Census and reflect changes to the April 1, 2020 population due to the Count Question Resolution and Post-Census Group Quarters Review programs, geographic program revisions, and the application of disclosure avoidance to protect confidentiality. The Office of Management and Budget’s statistical area delineations for metropolitan, micropolitan, and combined statistical areas are those issued by that agency in July 2023. All other geographic boundaries for the 2024 population estimates series are as of January 1, 2024. See the Population Estimates Methodology for methodology statements.
Source: U.S. Census Bureau, Population Division. Annual Estimates of the Resident Population: April 1, 2020 to July 1, 2024.
Release Dates: For states, December 2024. For counties, metropolitan statistical areas, and combined statistical areas, March 2025. For cities and towns (incorporated places and minor civil divisions), May 2024.