
The Development Trends series highlights areas where investment is occurring around transit lines to show how transit can tie together housing, jobs, shopping, and more.
The Development Trends reports are annual reports that identify projects that add more than $1 million in building value over a one-year period along the 22 TOD corridors in Cuyahoga County. These reports serve to show trends in TOD investment in Cuyahoga County.
2025 Edition: Development Trends on TOD Corridors
The 2025 Edition of the Development Trends on TOD Corridors report looks at data between 2019 and 2024. New to this year’s development trends document: developments were visually analyzed to determine whether they conform to criteria for transit-oriented design. These criteria include the following: TOD must be multiple stories, close to the street, parking located to the rear or side, a TOD-friendly use or mix of uses, and a front-facing building entrance.
Since 2019, Cuyahoga County has seen 161 new TOD projects, including new construction and redeveloping existing buildings into TOD-friendly uses. Data shows that new investments in TOD is increasing with 2024 having the most TOD investment ($298m) since 2019.
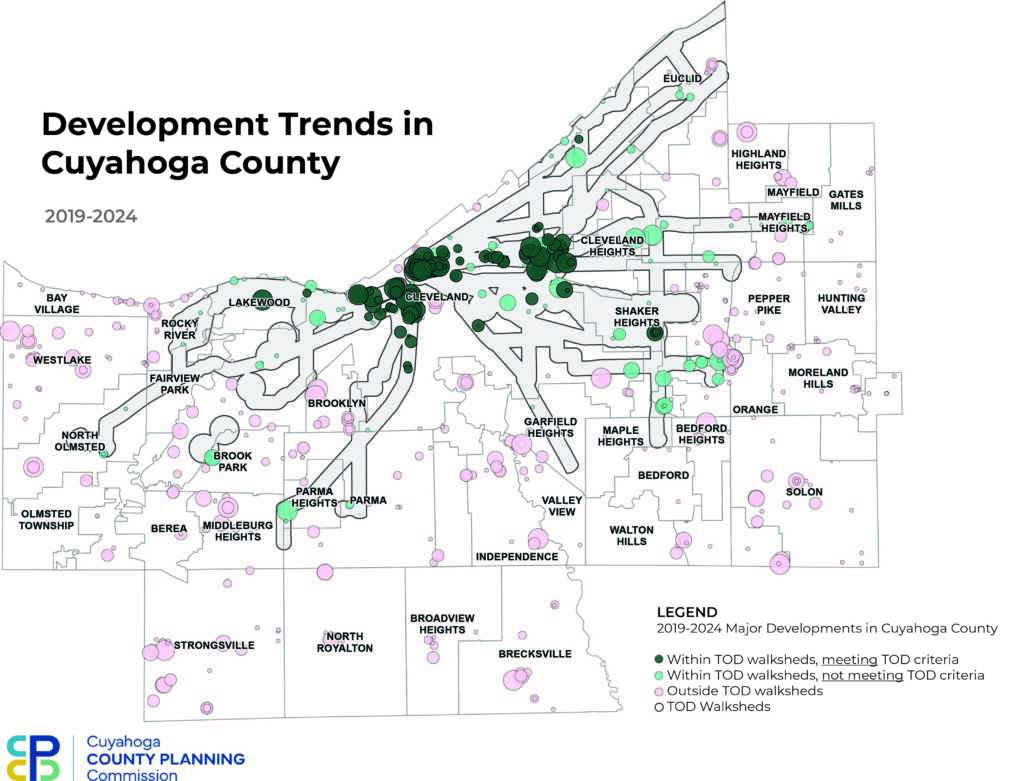
Core findings from the report include:
- From 2019 to 2024, $1.2 billion worth of building value was added through new TOD development. 33.6% of all new development in Cuyahoga County between 2019 and 2024 met the criteria to be considered TOD.
- In 2024 alone, $298 million was invested in new TOD development, which is higher than any year since 2019, signifying the increased desire to build along frequent transit lines.
- The City of Cleveland has seen the most TOD development since 2019, with 92.8% of all new TOD built there. Between 2019 and 2024, just 4 communities in Cuyahoga County have had at least one major TOD project; Cleveland, Lakewood, Cleveland Heights, and Shaker Heights.
Previous Development Trends Documents
Data & Sources
- Data in this document comes from the Cuyahoga County Fiscal Office, which maintains a complete historical record of all property transactions; maintains records of property ownership, valuation, and taxation; and collects special assessments for public improvements. Specifically, this document uses the Fiscal Office’s Delta Track data, which shows the change in valuation data from one year to the next.
- Developments in this report include only those projects which added more than $1 million in building value over the course of a year, and the data may not include certain tax-exempt projects for which significant portions of value are abated or exempt. This document does not account for changes in land value and analyzes only the value added to the buildings included in each new development during construction or renovation.
- Throughout the report, references may be made to developments, major developments, and projects—these terms are interchangeable and in all cases are referencing developments that meet TOD design criteria and have an added building value of more than $1 million over a one-year time frame.